Libraries are a volume-business
This is a term I have been using for some years now when talking about public libraries. And what astonishes me is the number of people – library managers, Council Executives, policy makers – who instantly grab their pen and scribble down this extraordinary insight as if it’s something we didn’t already know. Maybe it’s the slightly economic flavour of the language, or the brevity of the phrase – I don’t know. But it amuses me because all I’m saying is …
The more people you have, the greater the demand for library services.
More population = More members = More visits = More borrowing = More of everything.
As your population grows you’re going to need to spend more money, on more staff and bigger branches, although the $ per capita may stay the same (or even drop a little because of scale efficiencies).
More people means bigger library spaces and more places for them to sit.
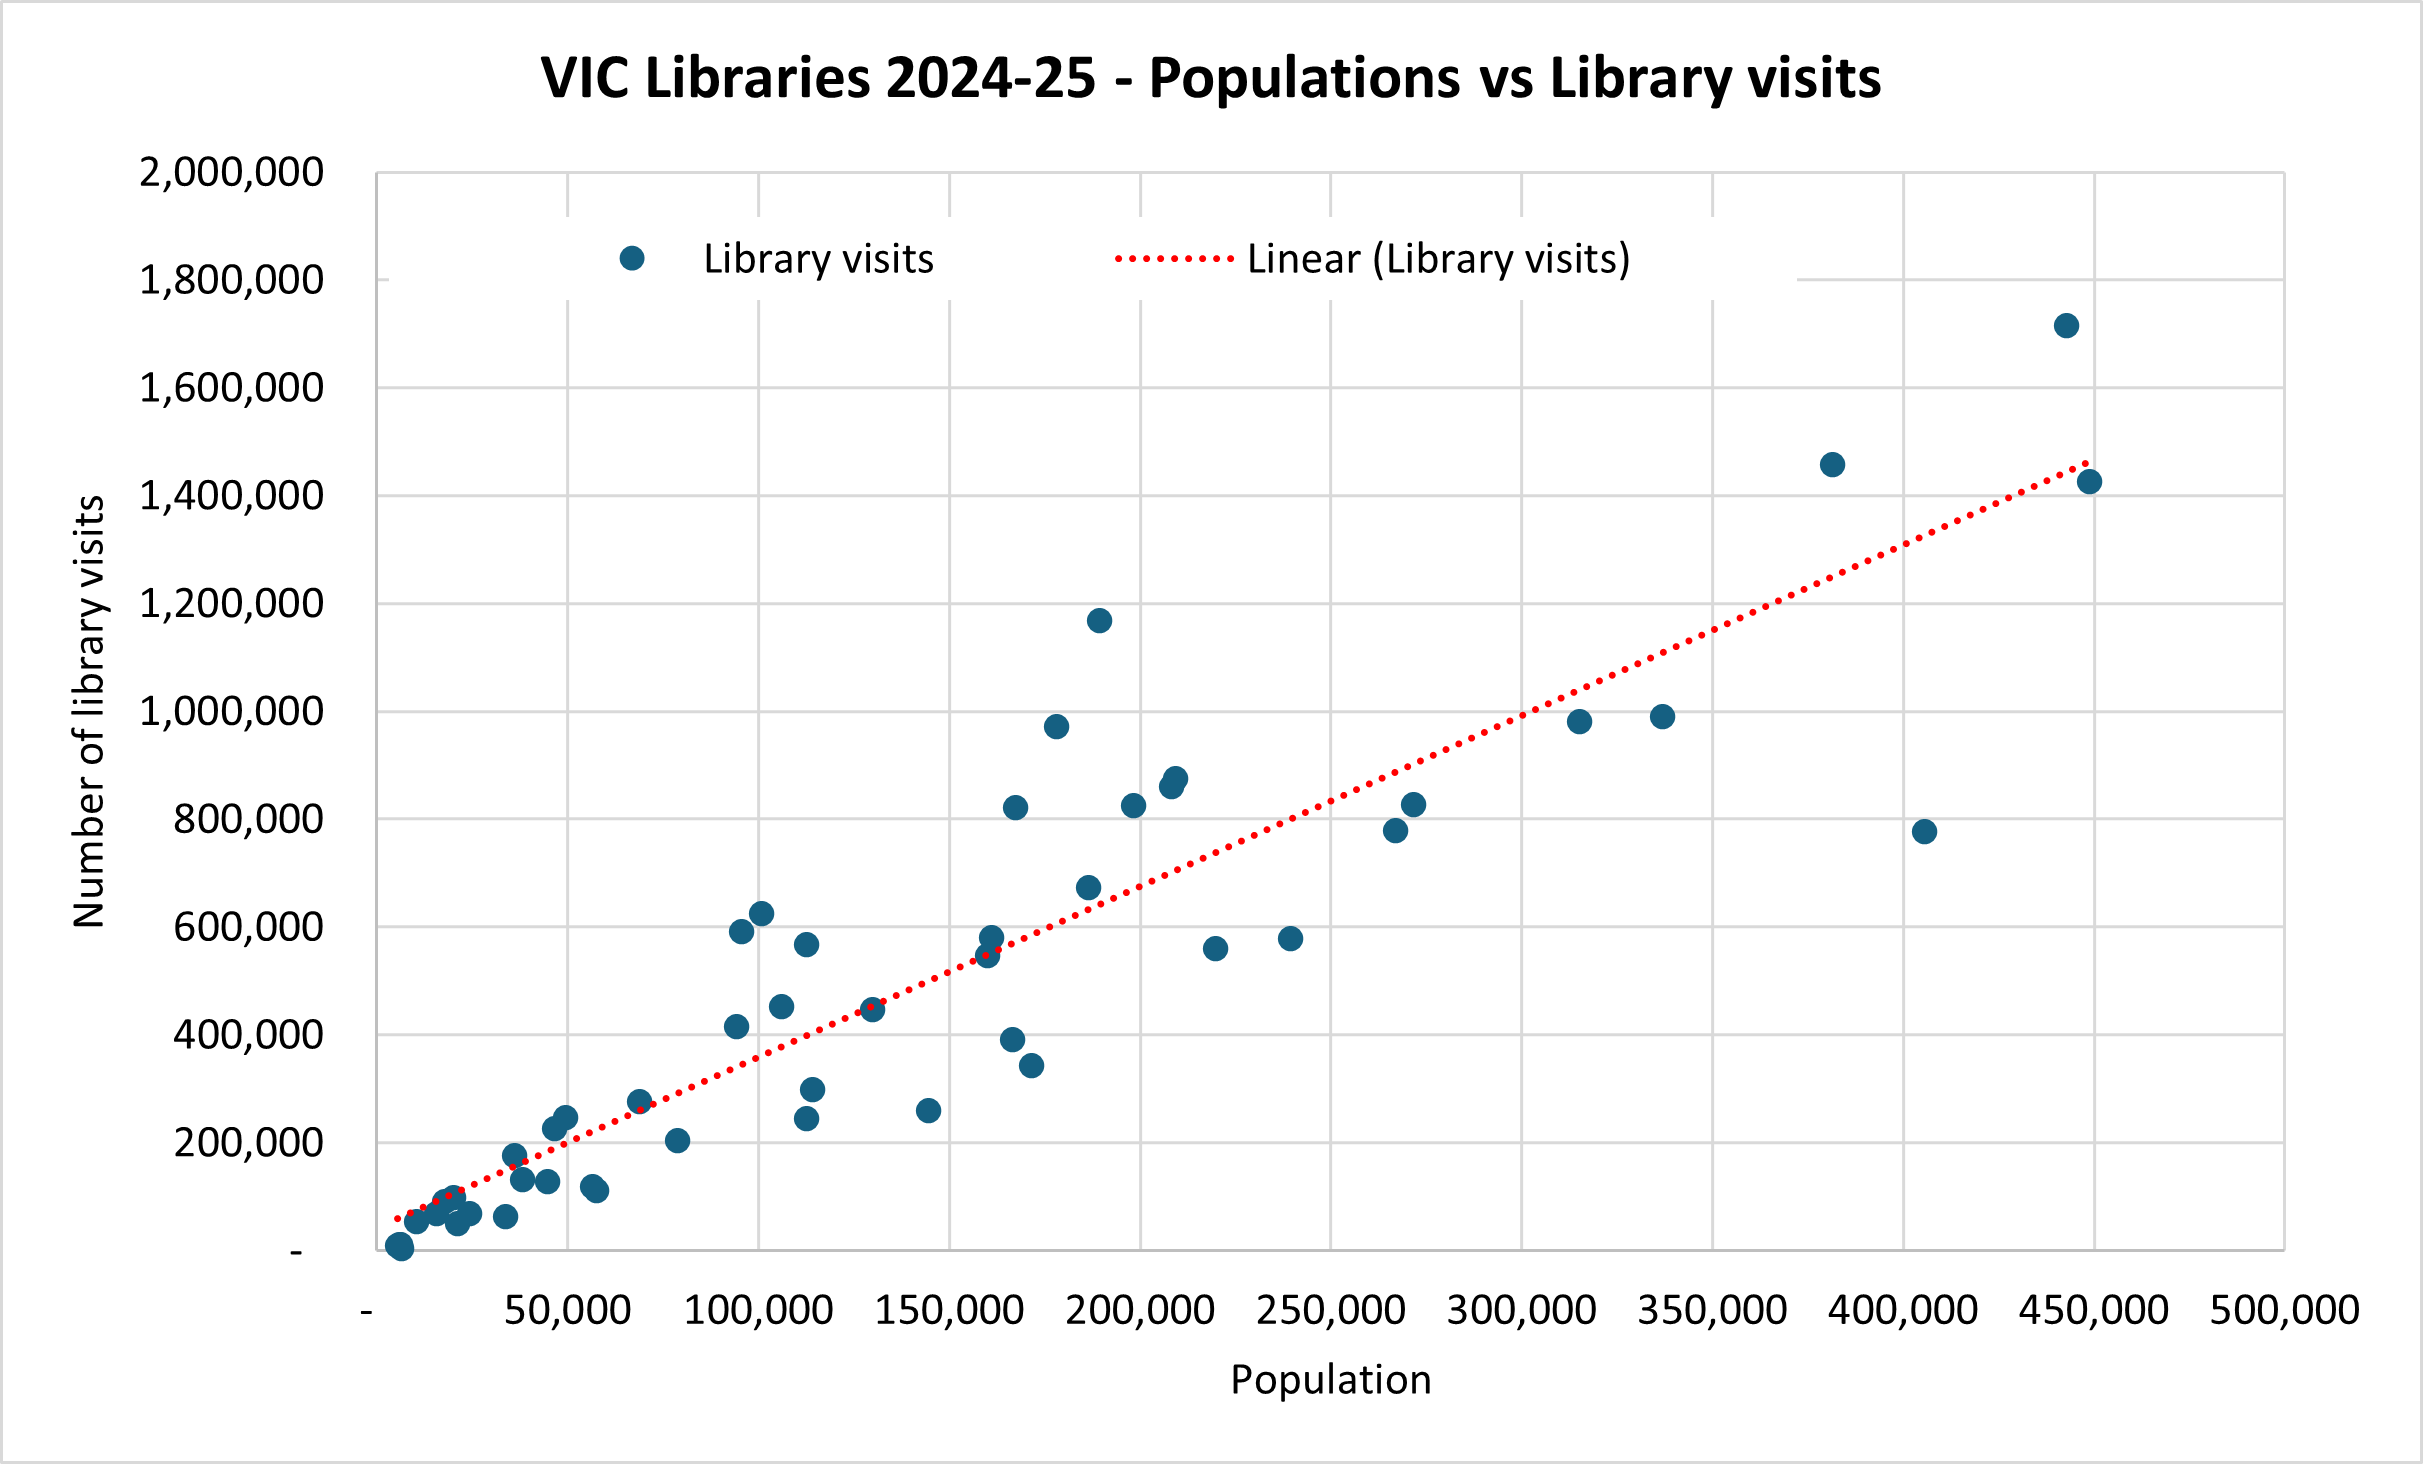
And proving this proposition is the simplest thing in the world, because all you need is a graph showing the number of visits to a library service in any year (or loans or program attendances) vs the size of the resident population.
Let’s, for example, take visits to Victorian libraries in 2024-25. It’s pretty clear that the libraries with the largest populations (that is, Yarra Plenty, Your Library, Connected Libraries, Geelong Regional) have the highest number of total visits. No, it’s not a perfect correlation but on a scale from 1.0 (perfect positive) to -1.0 (perfect negative) a correlation of 0.90 is enough for me to say with extreme confidence that larger populations result in more library visits. And that this is true regardless of location (inner metro, outer metro, regional, rural) and of demographic profile (age, socio-economic status).
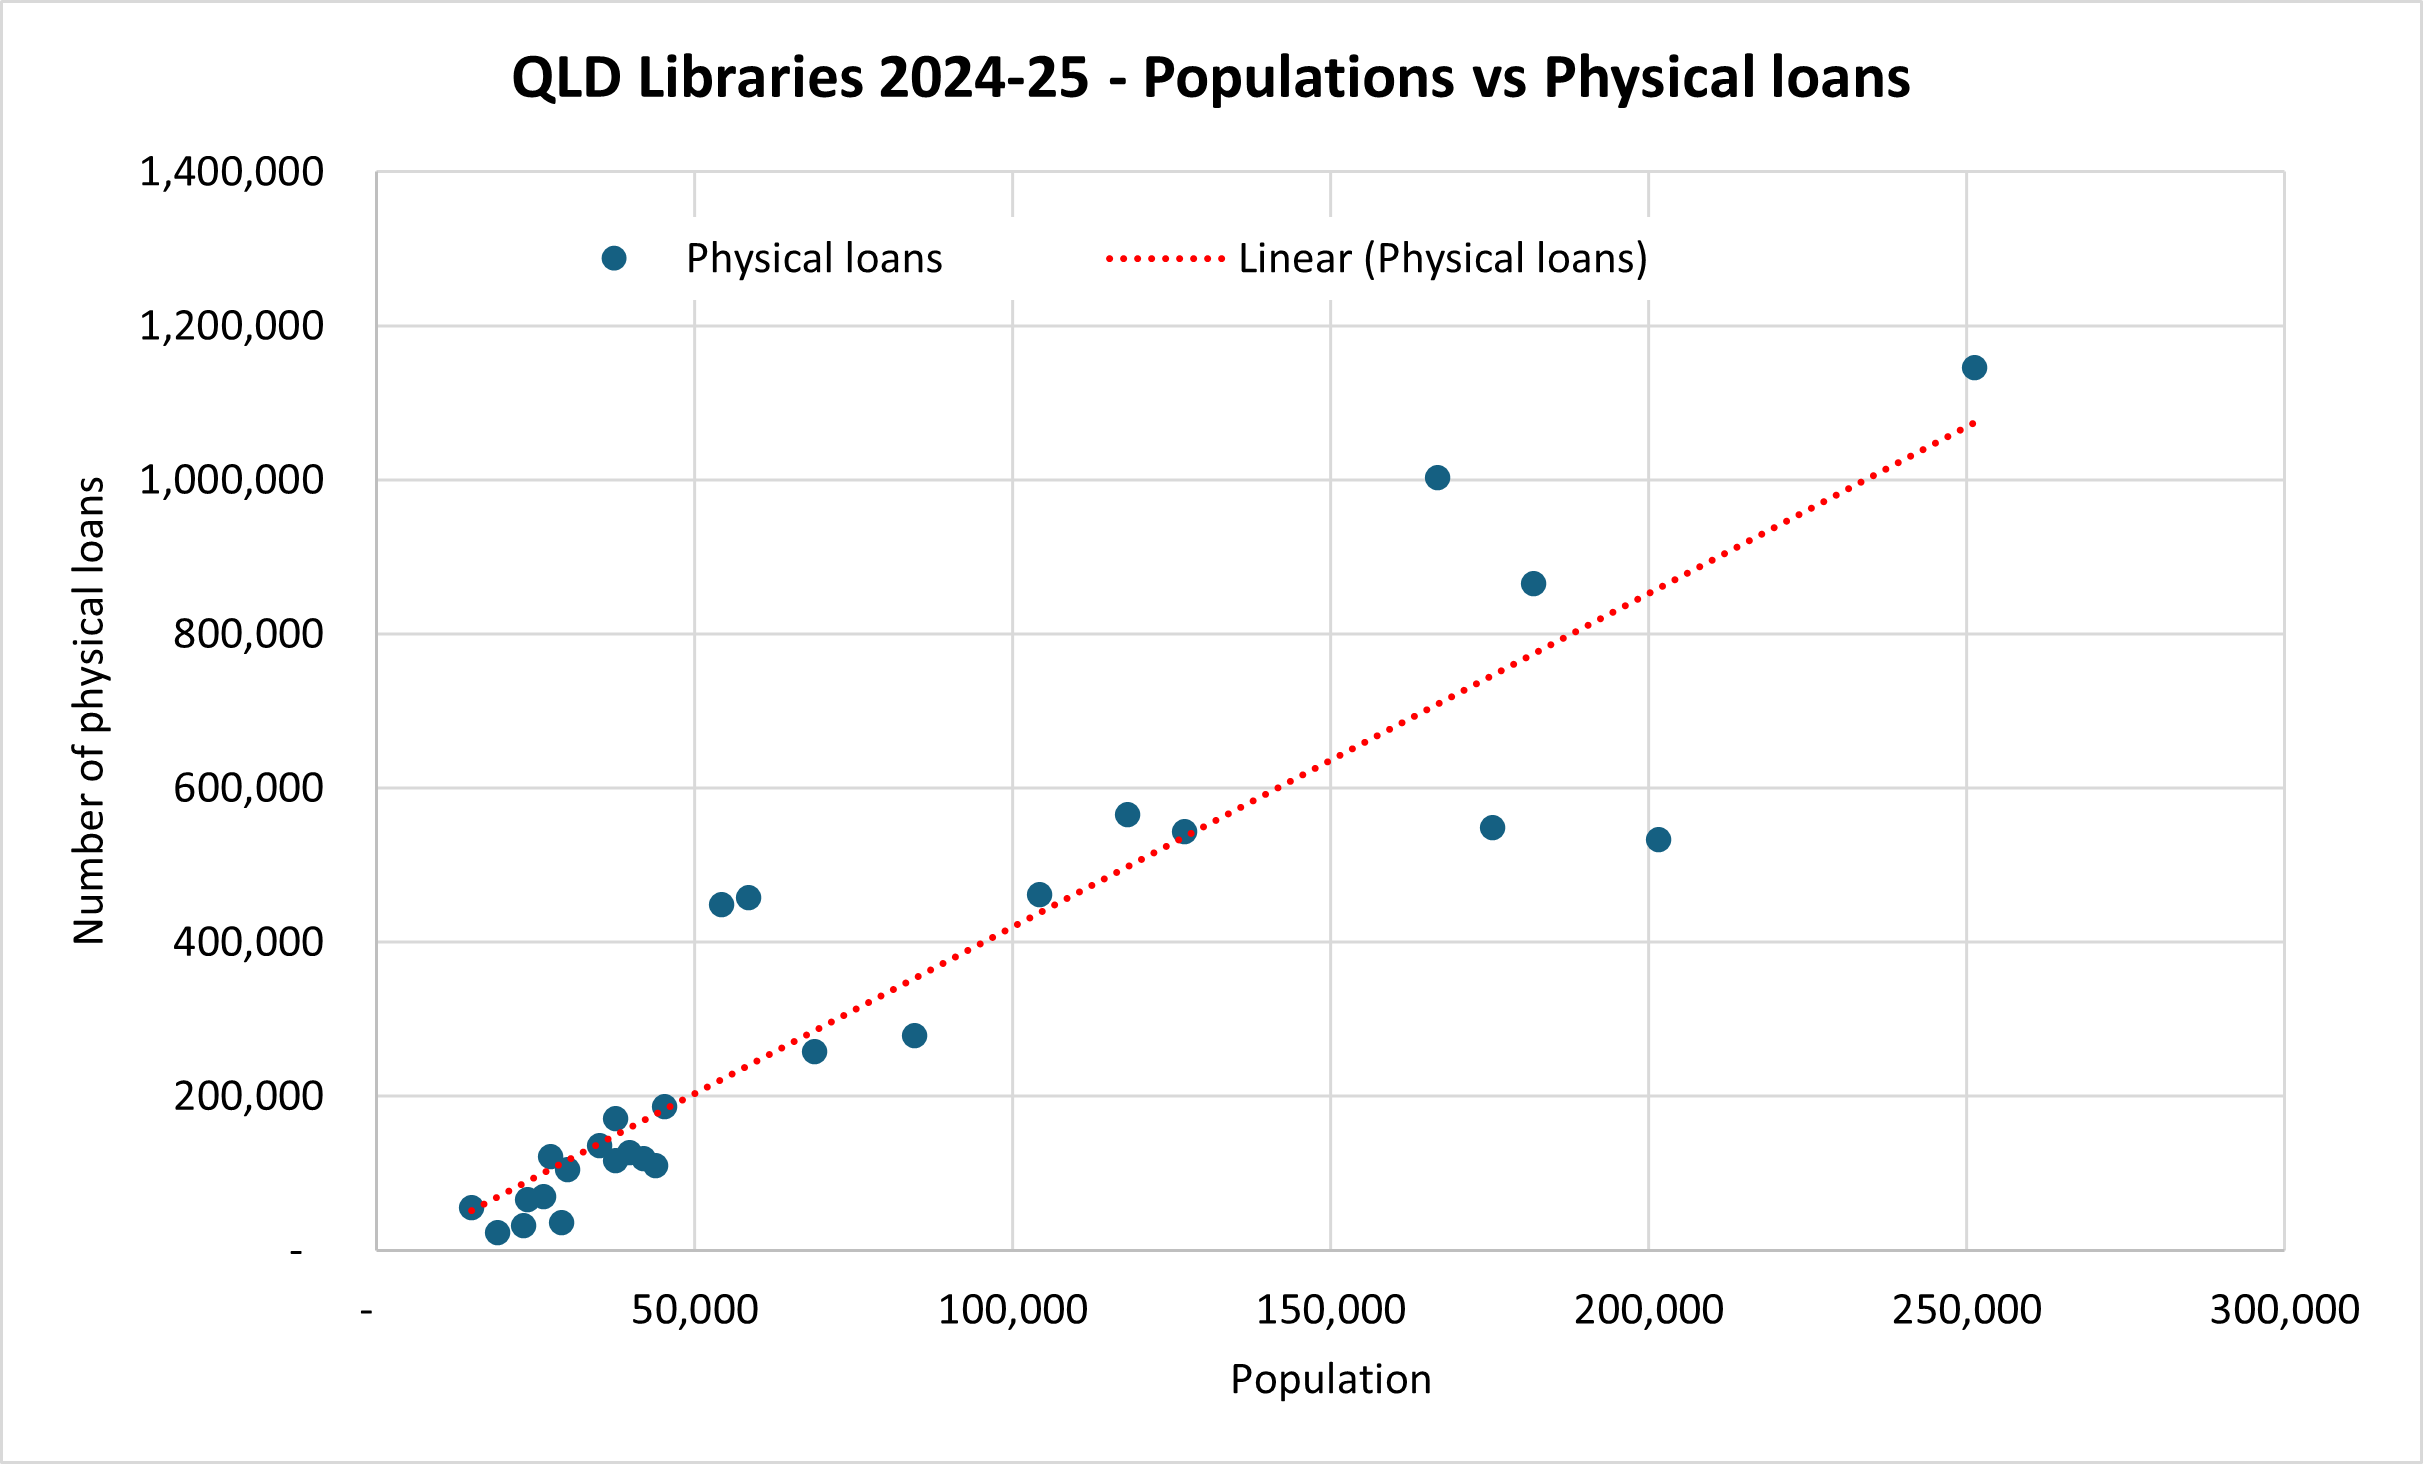
What if we looked at loans of physical items in Queensland in 2024-25.
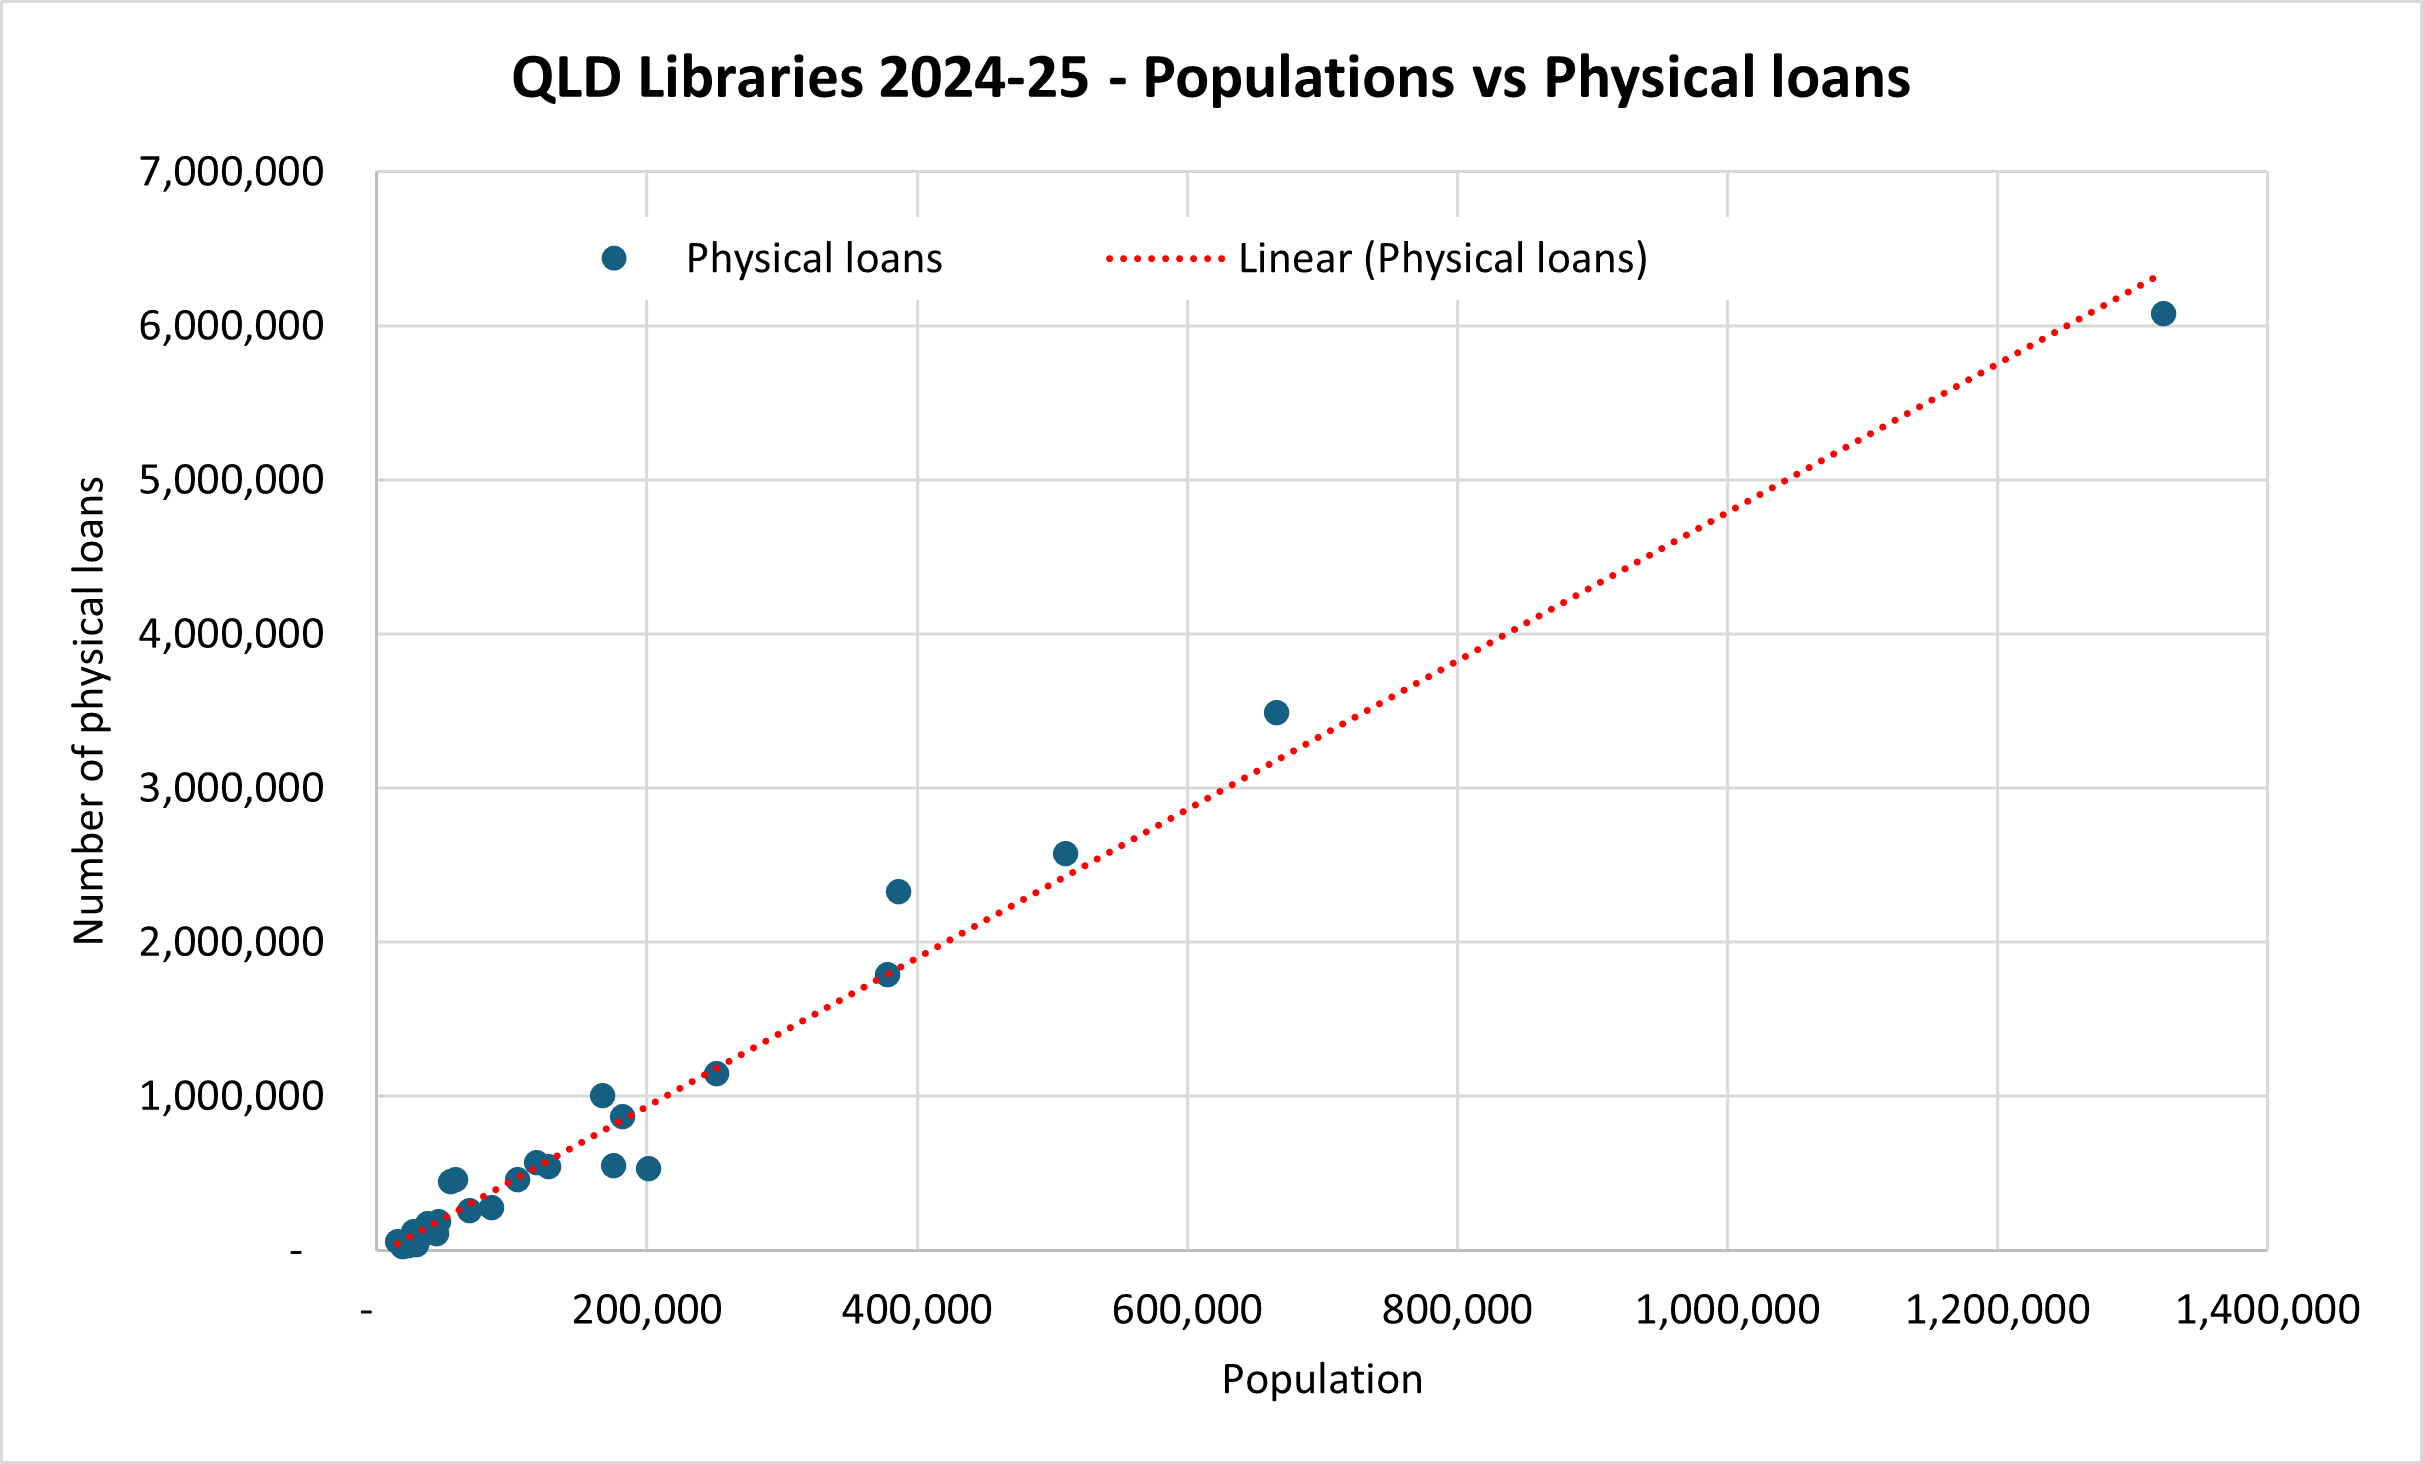
That looks like another rising trendline to me – with a correlation of 0.99! But is this finding skewed by those five very large LGAs with populations in excess of 300,000 (that is, Brisbane, Gold Coast, Moreton Bay, Sunshine Coast, Logan)? Well, if we remove them and top out in Ipswich with a population of 251,000 our correlation “plummets” to a still incredibly high 0.92. It’s pretty clear that more people make more loans."
Finally, to complete the set on the Eastern seaboard let’s look at program attendance in NSW Libraries in 2023-24.
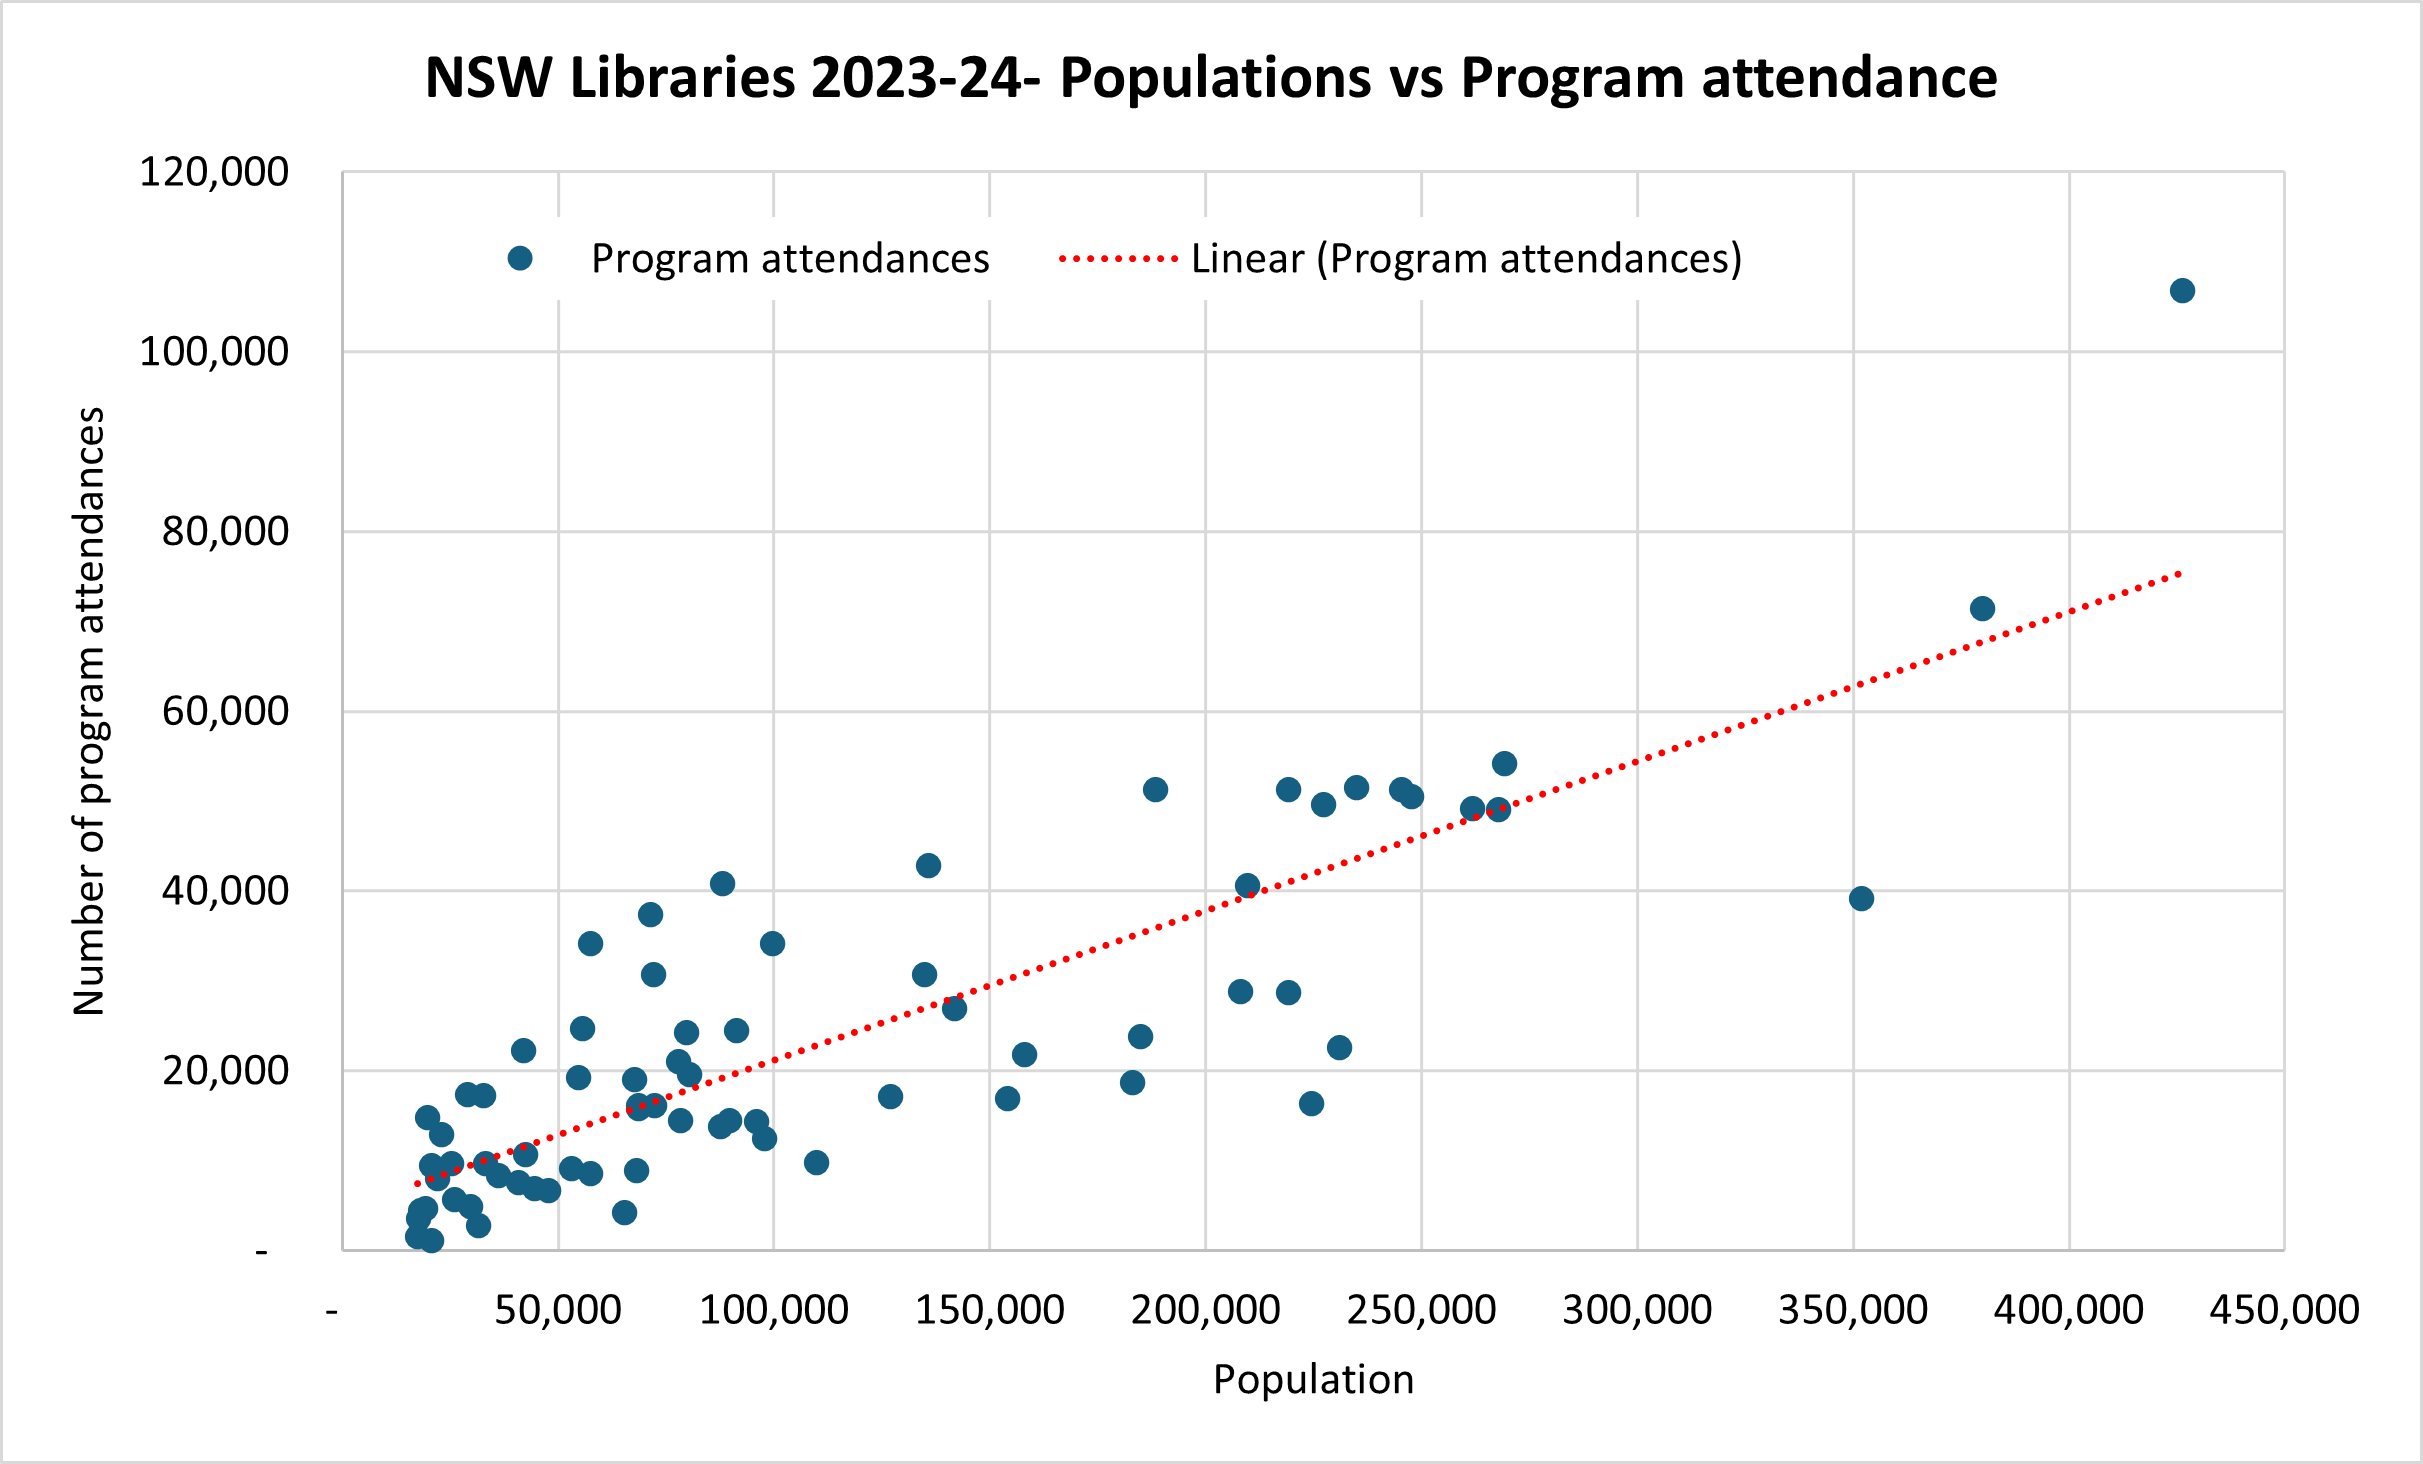
Another rising trendline and another very strong correlation of 0.84. Even dropping the three big LGAs (that is, Blacktown, Canterbury-Bankstown and Central Coast) only drops the correlation to 0.79. The larger the residential population the more people will attend library programs – and we haven’t even considered what number or type of programs these NSW libraries are offering.
Any way you look at it the answer is the same – Libraries are a volume-business.
All of which explains why we can confidently benchmark library usage in LGAs of different size through population adjusted metrics like visits per capita, loans per capita and program attendance per capita. And it’s at that point where we can meaningfully introduce all of those other locational, demographic and service-related factors to explain the subtle differences between Brisbane and Blacktown and Boroondara.
So pop that little phrase in your mental notebook and use it the next time you need to advocate for increased funding and staffing as your population grows.