A Library SCOREcard – Performance on a page Part 2
So … my last blog piece A Library SCOREcard – Performance on a page (https://www.analibraryse.com/blog/a-library-scorecard-performance-on-a-page) introduced the idea of producing a consolidated summary of public library performance and impact that simultaneously speaks to the interests of library customers, the community, funding organisations, the library industry and the local library itself. This article will show you what a SCOREcard could look like and how it could be produced.
Here is the Library SCOREcard for Camelot Libraries. Obviously not a real library – although all of the quotes and data below belong to real libraries, just not the same one. Names and places have been changed so as not to give anyone’s data way.

So what have we got.
1 page
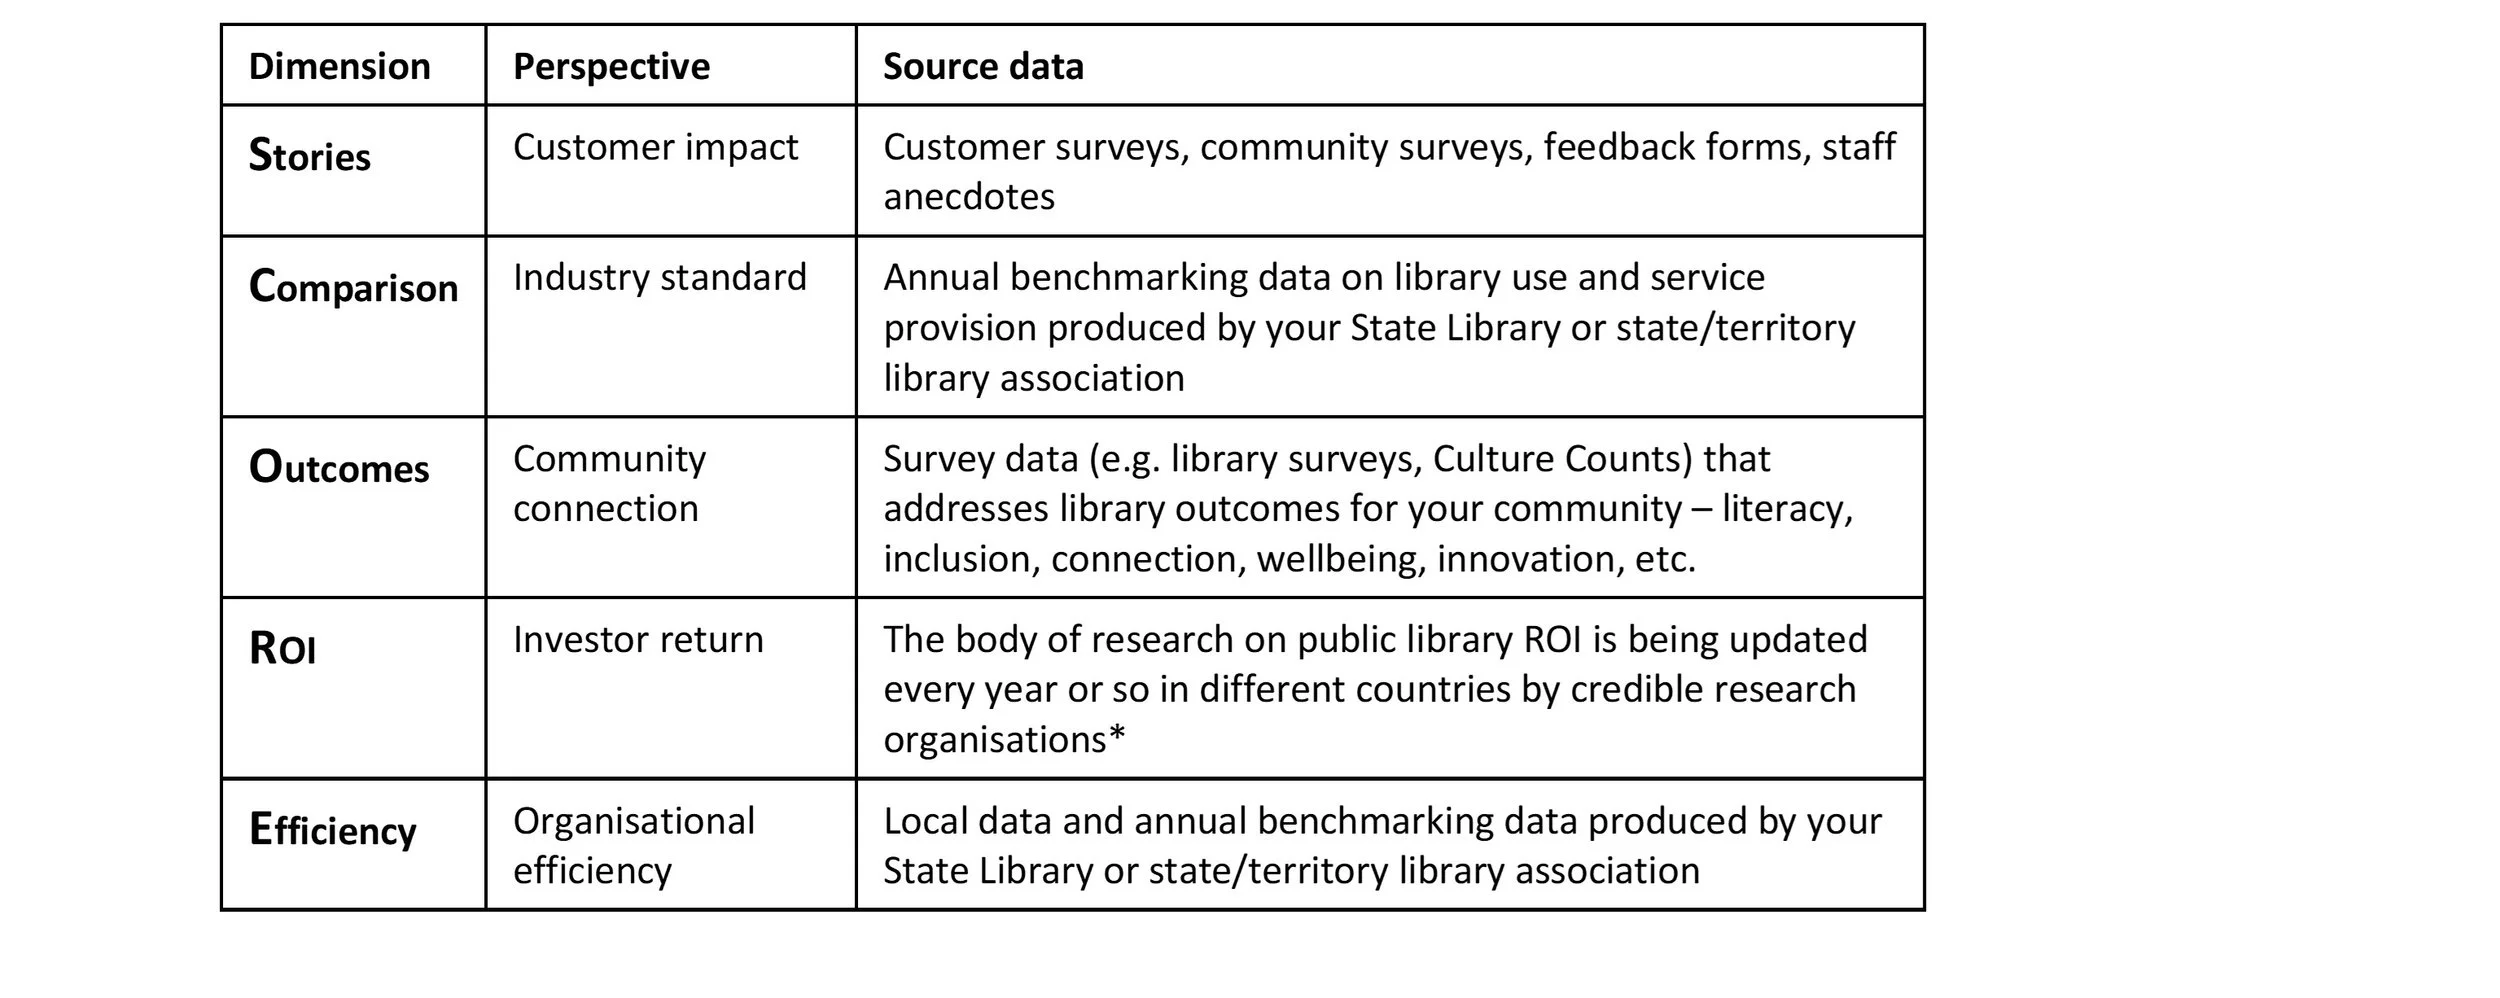
5 complementary types of data
Answers performance and value questions for different library stakeholders
Draws on library operating data, state and national benchmarking data, customer and community surveys, and industry research
Populated by the best data the library has to hand (use whatever you’ve got)
Backed up by a 5-6 page document that contains all of the source data (around 0.5 to 1.5 pages for each of the 5 sections)
Can be customised for particular audiences
Produced annually
Updated when new data becomes available.
The key is bringing together all of your data into one set where you can pick and choose the data and quotes that best tell the story of your library service in your community (which does mean being prepared to show the good stuff and the not so good stuff). For example, the sample SCOREcard has 5 quotes and anecdotes under Stories. My back up document has the best 20 quotes from the most recent community survey for this library. And the Comparison page has a full table of benchmarking data from which I chose a few items for the SCOREcard. My ROI page references six pieces of research from the past 15 years. The more cards you have in your deck the better you can play the game.
Now there is no perfect set of KPIs for each section (at least not yet) so just go with what you have. What you will find is that some sections can be filled in quite easily and others may look a little sparse to begin with. This will point to areas where there are gaps in your data sources and understanding of library service performance and value. For example, I’m still market testing the questions around community connections for the Outcome section, and working through what might be the best metrics to use in the Efficiency section. More importantly, I am working with a couple of libraries on developing a public library ROI calculator but that’s not yet ready for publication (Special shout out to my good friends at City of Swan Libraries).
And then the most important thing you can do is to sit down with different stakeholders and talk to them about what you’ve found. Start a conversation. Chat about this among the library team. Present your results to Council. Share those great stories and anecdotes with community. And bit by bit you will increase your understanding of how well your library is delivering for your community – efficiency, meeting needs, value, impact – and how you can be even better.
My experience suggests that most larger library services are already pretty good at their performance reporting. However, some medium-sized and smaller libraries are so busy delivering services that they don’t have time to do the necessary task of closing the loop and demonstrating their value to the community. For them, the Library SCOREcard might be a useful tool.